Close
Each tailored shareholder report provides an overview of a fund, so you can stay up to date on its key information and developments. An annual report is issued at the close of each fiscal year and a semi-annual report is created after the fund’s 2nd quarter.
Here we’ll cover important aspects including:
Individual fund reports must be mailed or emailed to all shareholders. A semi-annual report must also be provided six months into the fiscal year.
The Securities and Exchange Commission (SEC) is the governing federal agency that determines fund reporting requirements across mutual funds and ETFs. While each fund has some flexibility in report design, the new Tailored Shareholder Report rule specifies required content in a required order. Reports must also be brief and written in plain English.
The fund report is one way to keep up with investment performance, fees, holdings, financial conditions and material changes. Reports are created twice per year. Typivally, fund’s website provide the latest performance information.
It is very common for companies to issue shares with different classes. Be sure you understand differences in fees and expenses for share classes. The Tailored Shareholder Report you receive will be for the share class you own.
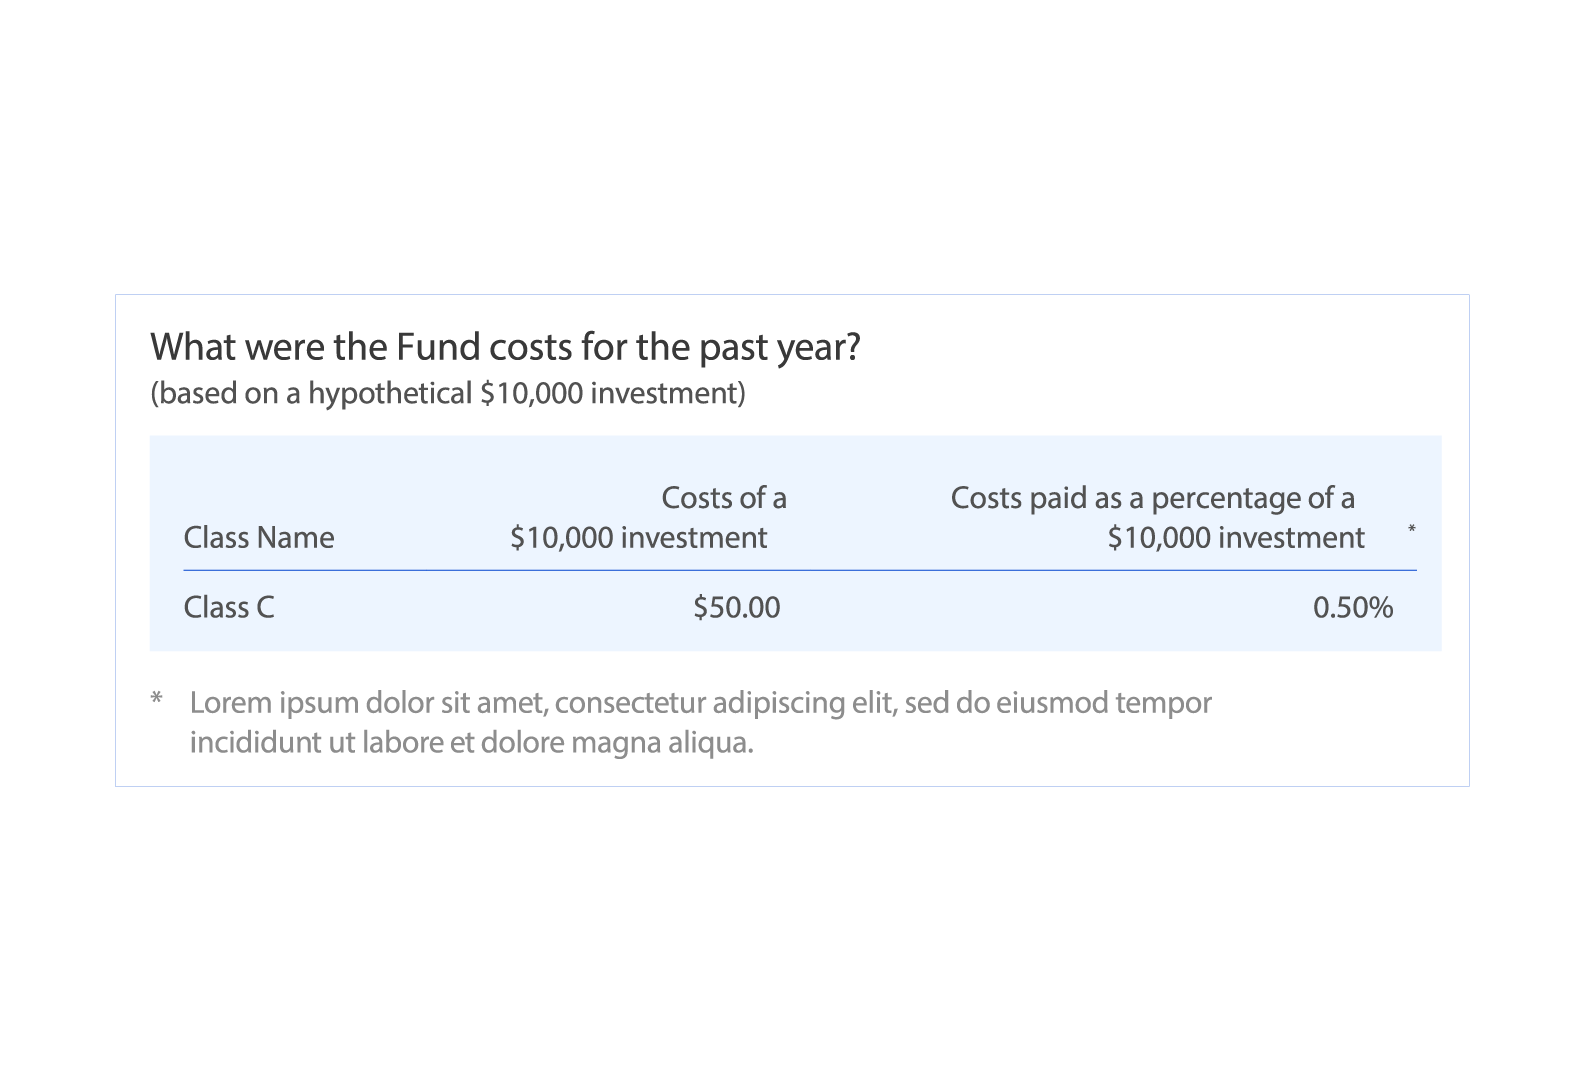
Fund performance begins with the gains, losses and income earned. Fees and expenses are then deducted to create a net gain or loss, which affects your bottom line. Given this importance, the SEC requires funds to disclose all expenses associated with managing your money in a standard format.
Common Questions
Expenses may include management fees, distribution & service (also called 12b-1) fees, transfer agent fees, and administrative costs among others. The combined fees are the best foundation for comparison—those are represented in a fund’s total operating expense ratio or percentage. The new summary report also provides this amount in dollars based on a $1,000 investment. You can multiple this amount by your fund balance to understand what you paid over the previous year.
It depends. Expenses will vary based on many elements including the complexity of the fund’s investment strategy. For instance, an index fund will naturally come with lower expenses than would a global fund due to differences in the resources used to manage the fund. So, a fee comparison is more useful when comparing similar or peer funds.
They can. Since fees are calculated based on the operations of the fund, there may be some fluctuations. However, if you notice large deviations in expenses over time— or if fees increase relative to comparable funds—you should assess whether a similar less expensive fund is a better alternative.
Fund management will sometimes waive certain fees. Should this occur, details will be disclosed in your fund report, including how long a particular fee will be waived.
Narrative MDFP Disclosure
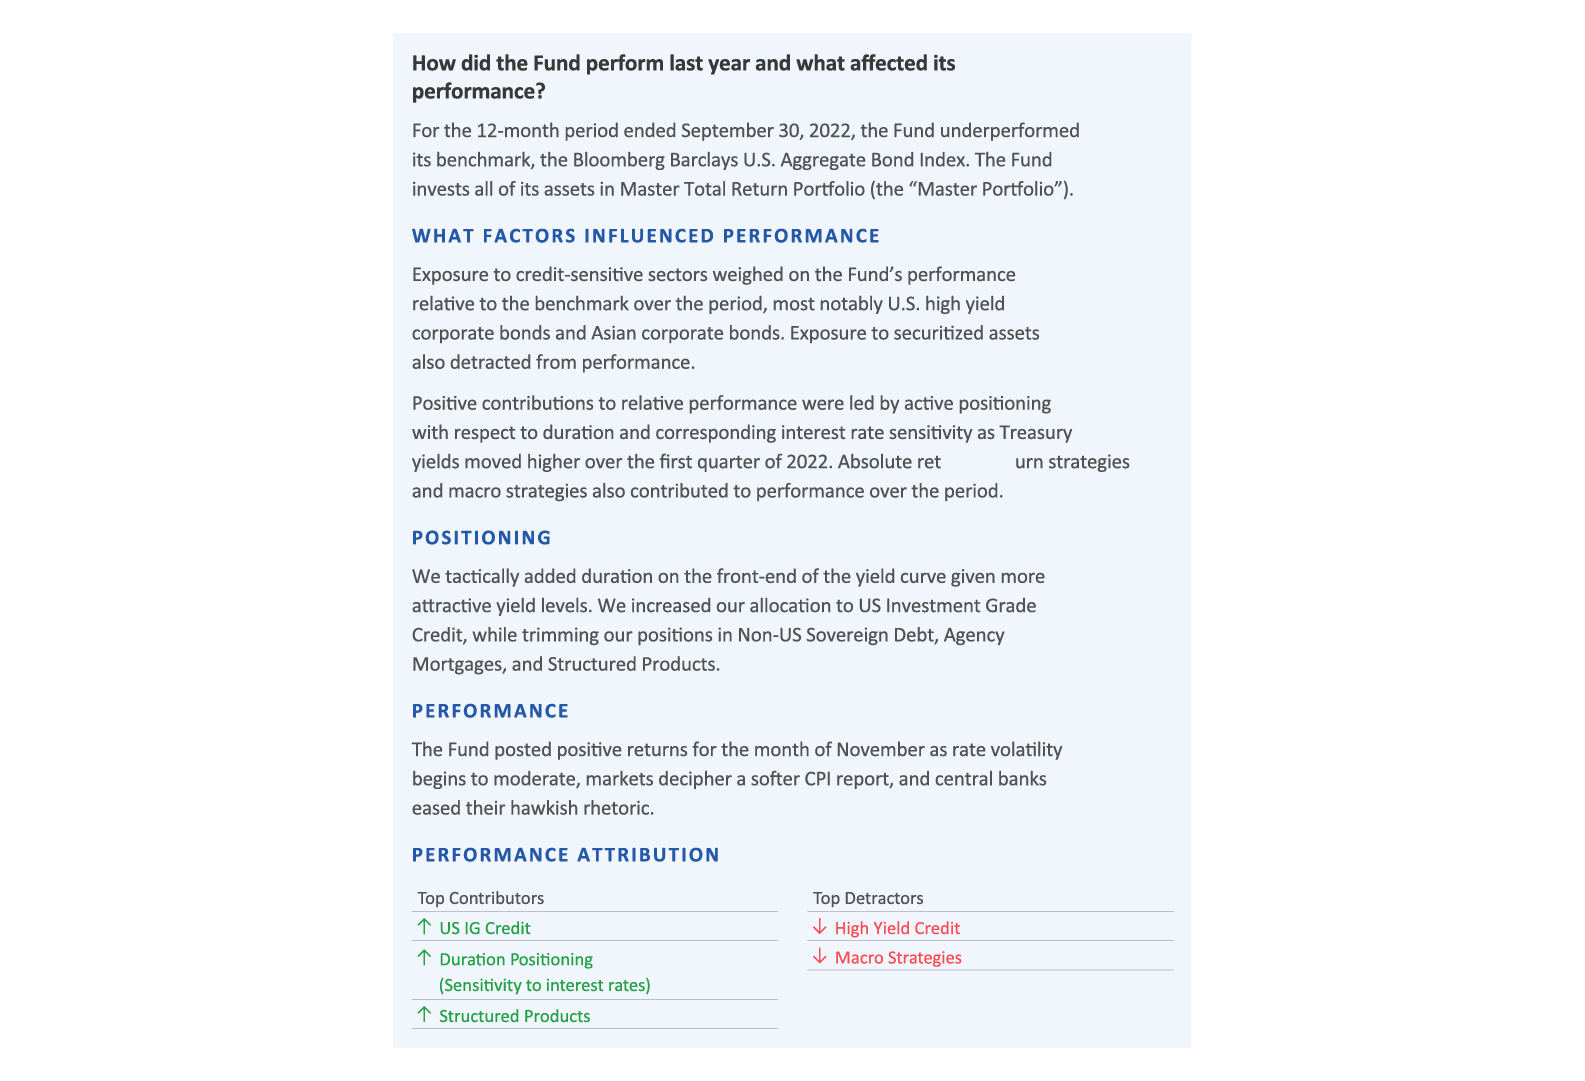
A fund must include a brief narrative discussion of the key factors that materially affected the fund’s performance during the most recent reporting period, including the relevant market conditions and the investment strategies and techniques used by the fund’s investment advisor. Funds are directed to use graphics or text features to present the key factors, as appropriate. The Narrative MDFP is not required for semi-annual reports, but some funds may include it.
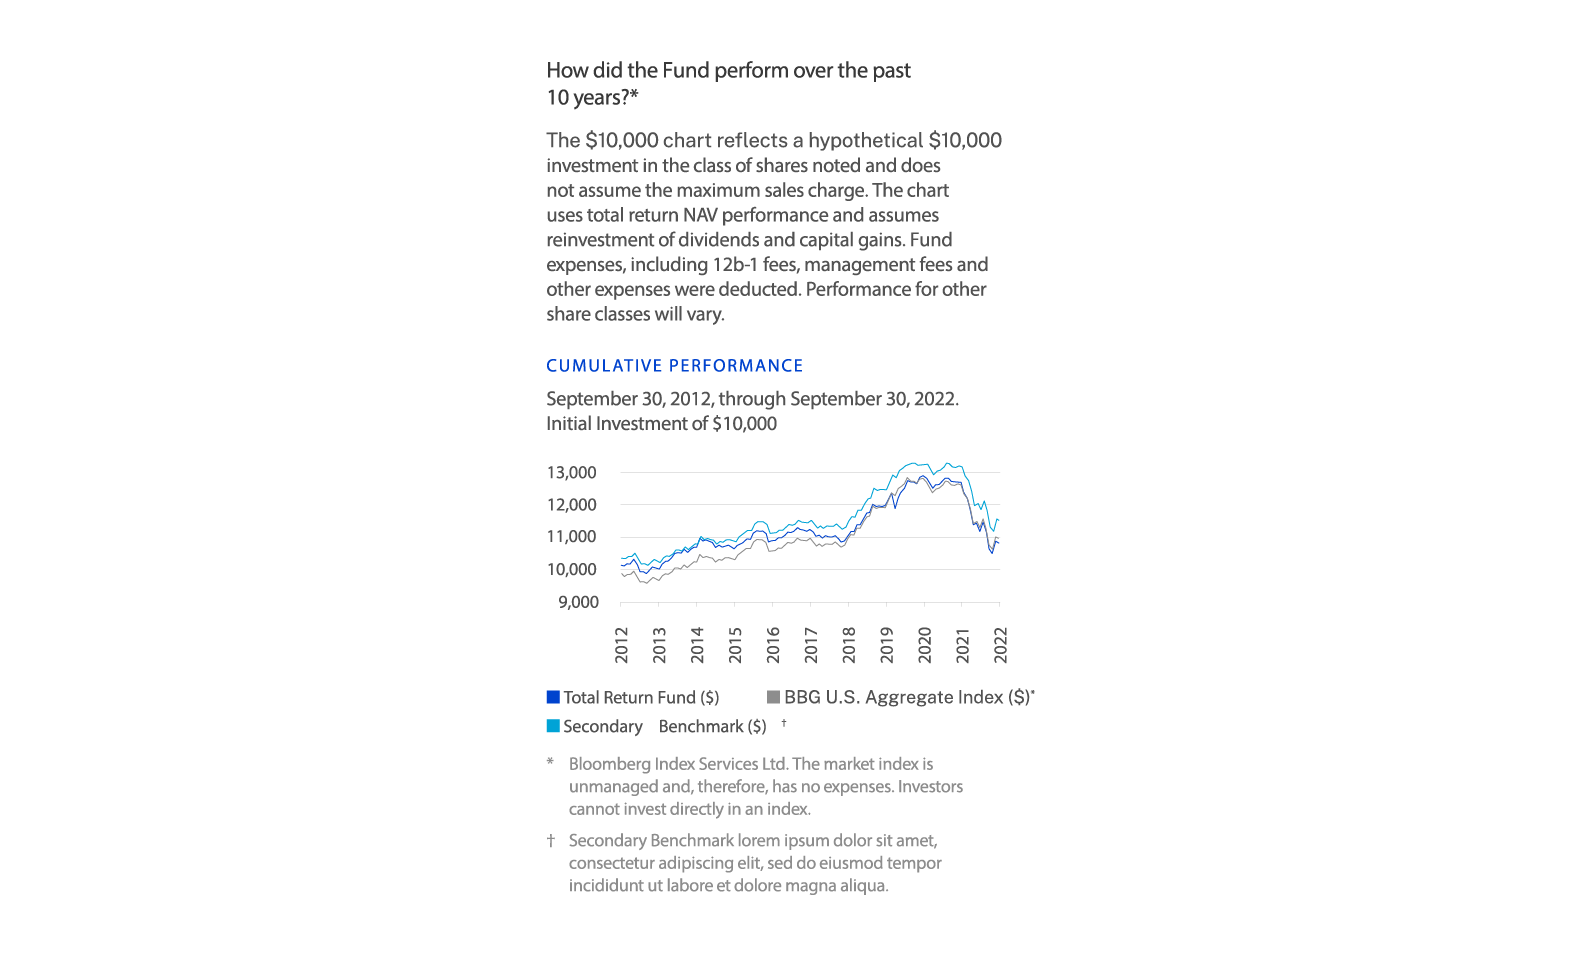
A mountain chart of the fund’s performance during the past 10 years (or over its lifetime if shorter) based on a hypothetical $10,000 initial investment alongside a broad-based benchmark.
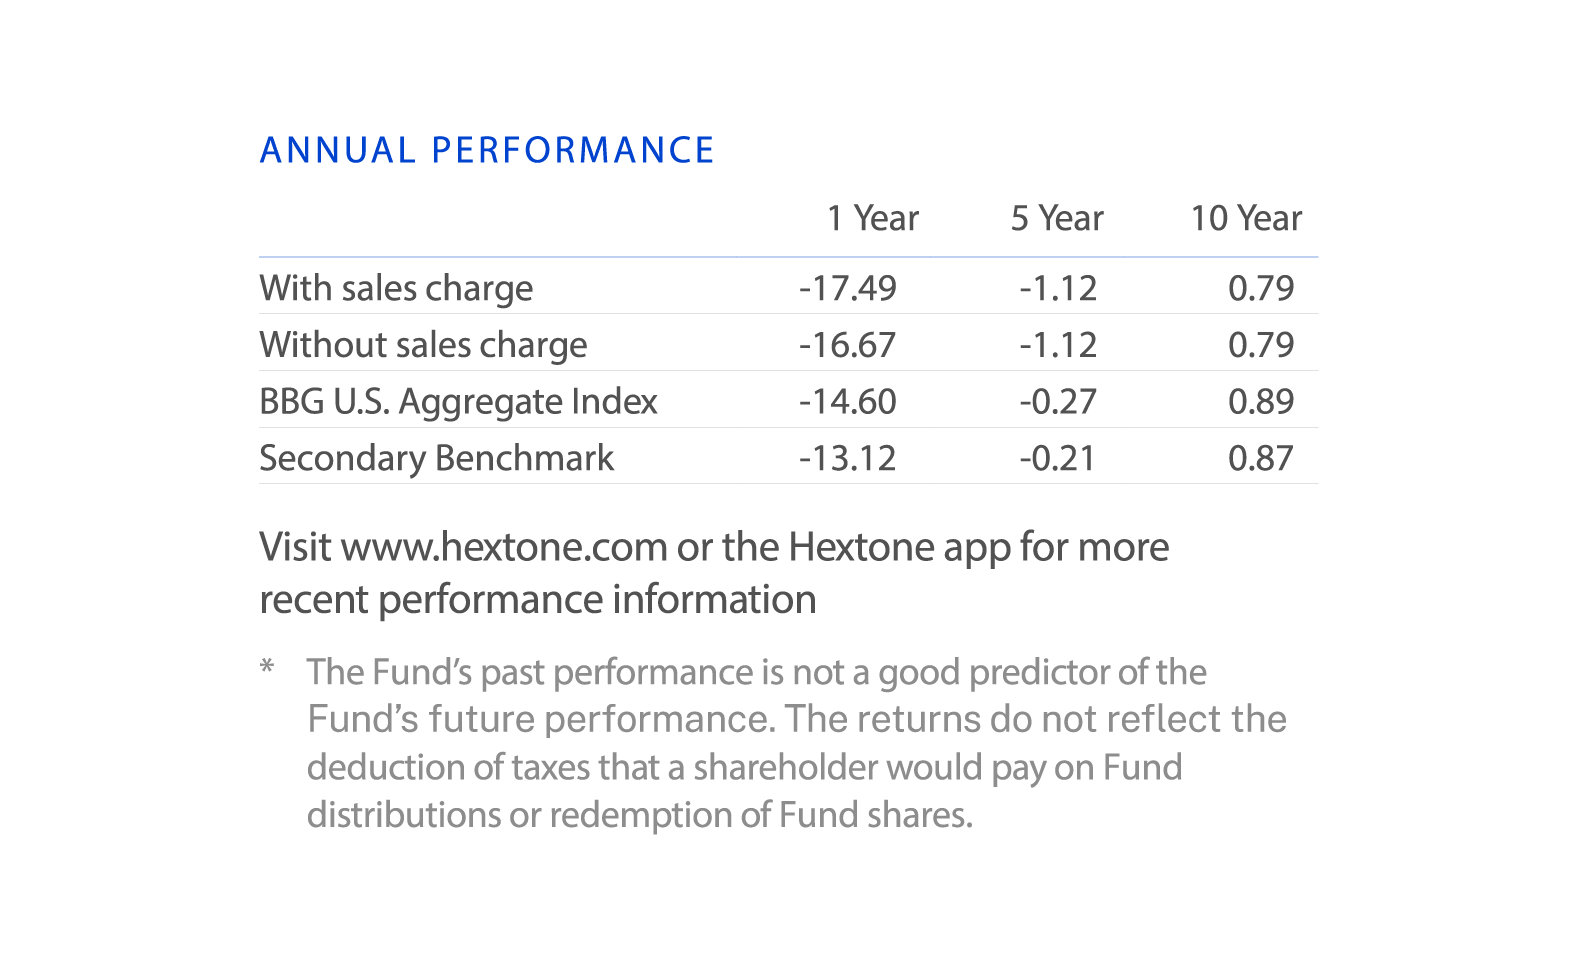
A table showing the fund’s average annual total returns for one, five and ten-years (or over its lifetime if shorter).
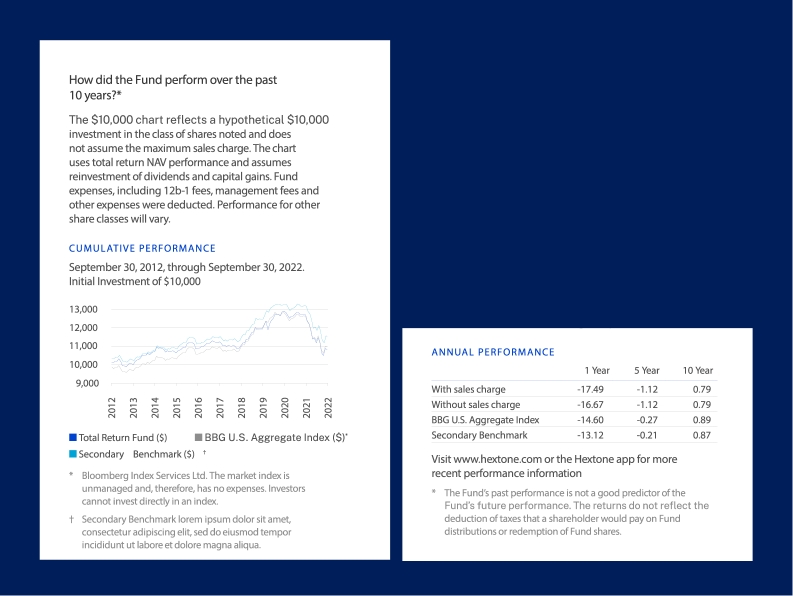
This chart offers a glimpse into performance over time—and is always based on a hypothetical $10,000 investment. To provide context, your chart will compare fund performance alongside a broad-based benchmark index, such as the S&P 500. A fund also has the option of comparing performance to other indexes, including more narrowly based indexes that reflect the market sectors in which the fund invests.
Consider if you’re comfortable with the overall performance and volatility. Compare how well it aligns with the movement of the index. Keep in mind that volatility is generally tied to asset class.
For example, bond funds will generally fluctuate less than stock funds. So, if you are comparing performance charts for different investments, always compare similar funds to get the most relevant information.
A fund’s total return is affected by both the underlying performance of fund investments and its fees. Performance begins with the gains, losses and income your fund earns from its investments during a given period. Fees and expenses are then deducted to create a net gain or loss.
Keep in mind that your individual performance may vary based on the timing of your investment in the fund and other transactions.
This table makes it easy to understand fund returns for one, five and ten-year periods or the life of the fund compared to the benchmark(s) used in the line chart.
The average annual return (AAR) represents money earned or lost by a mutual fund during a specified period. This is shown as a percentage and takes into account three components: share price appreciation, capital gains and dividends. While averages can’t reveal trends, the AAR is a standardized metric that you can use to easily understand and compare funds side by side.
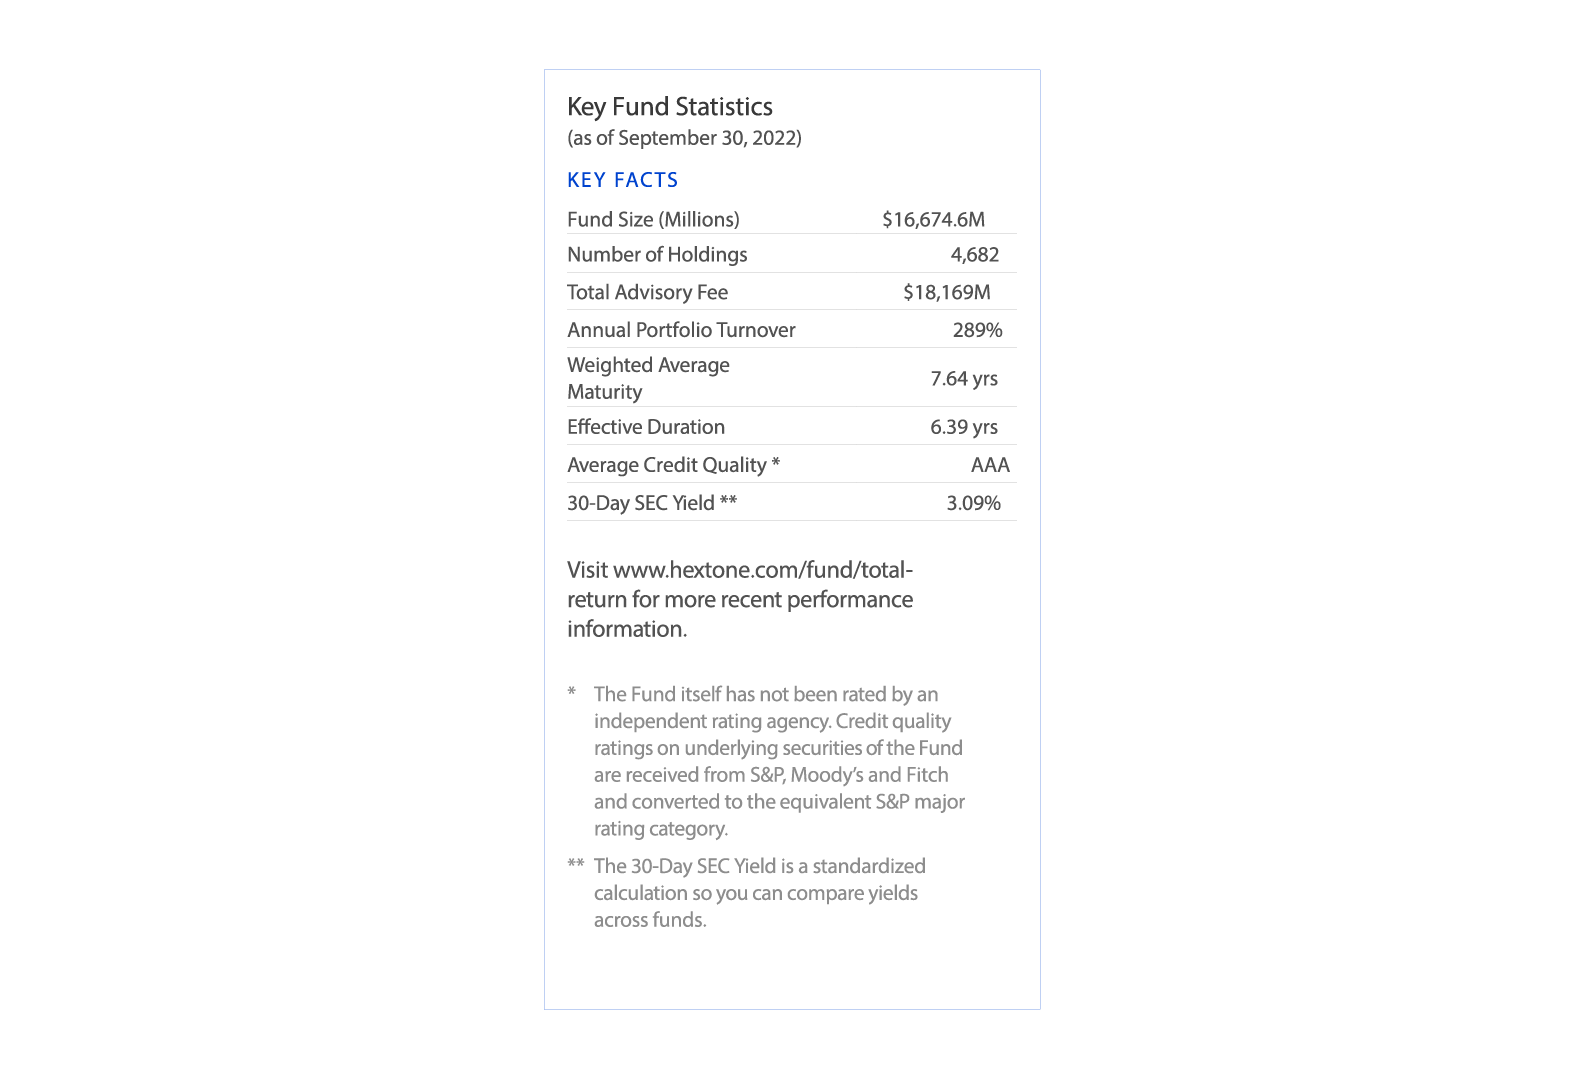
This section includes the fund’s: (1) net assets, (2) total number of portfolio holdings, (3) for funds other than money market funds, portfolio turnover rate, and (4) the total advisory fees paid by the fund during the reporting period, and (5) any additional statistics that the fund believes would help shareholders better understand the fund’s activities and operations during the reporting period.
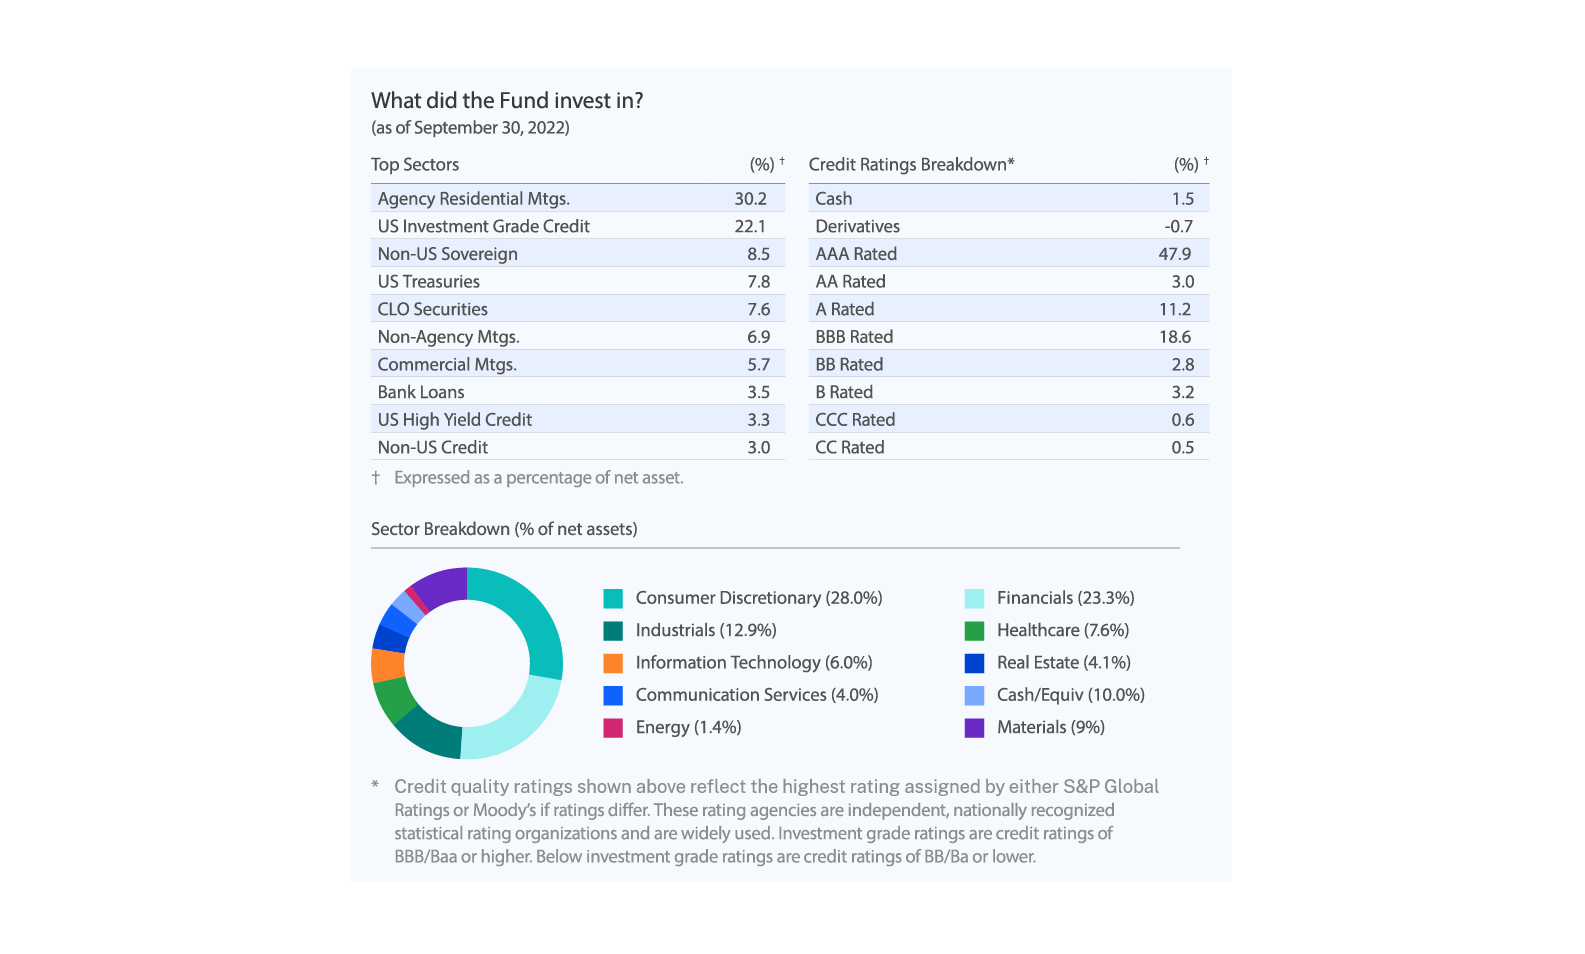
A fund’s holdings may include various stocks, bonds and other investments. Those holdings are selected by fund managers to achieve a certain level of risk and reward based on the fund’s objective. Your fund report is required to include a list of holdings and market value of each grouped by category. Funds have options as to the number and style of the graphs and charts. Other categories may include geographical region, type of security, credit quality or industry sector. These high-level summaries are often more informative than narrowly assessing each individual holding in a fund.
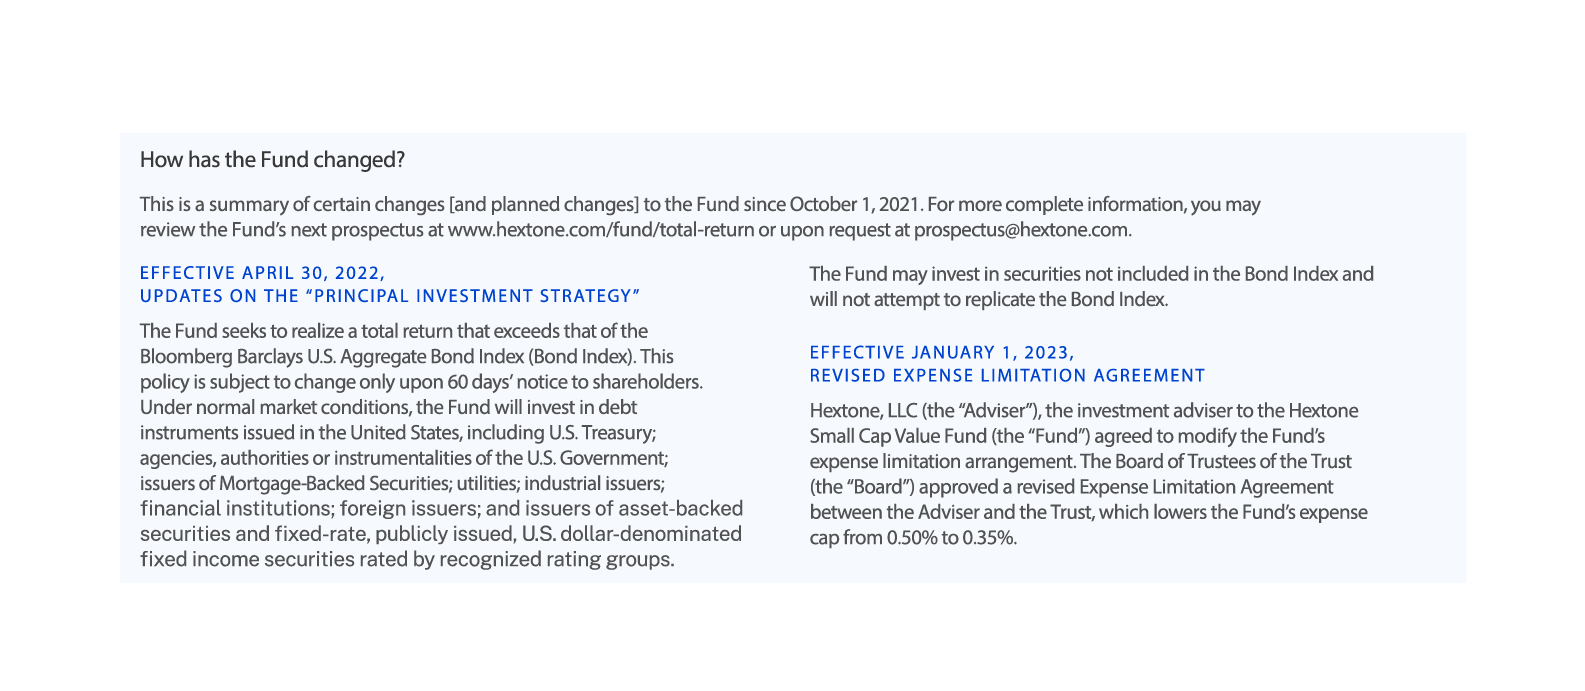
A Fund’s annual report must include a brief description of material changes since the beginning of the reporting period with respect to changes of the fund’s name, investment objective, strategies, principal risks, fees and expenses (and waivers), and investment advisor.
Your TSR will also provide details on how to obtain additional information about your fund, with both website information and a toll-free number. Consider taking advantage of your fund’s website for a more complete understanding of your investment
These summary reports, referred to as “Tailored Shareholder Reports”, will replace the long-form reports (and notices of website availability) that are delivered to investors twice per year. They are intended to make the content more concise and easier for investors to understand.
As a shareholder, you will receive these new reports twice annually for each fund you own. Each report includes, simplified fee and expense information, performance details, portfolio holdings, and material changes to help you monitor your investments.
No action is needed on your part: if you previously received reports via email, you will receive the new Tailored Shareholder Reports that way; if you received printed reports or notices by mail, Tailored Shareholder Reports will be mailed to you. More detailed information, such as complete financial statements, are available on the fund’s website and can be delivered upon request.
Setting aside a few minutes to assess the key elements of a fund report can help you feel confident your investments are on track, or if you may want to consider changes. We’ll show you what to look for in this easy-to-follow guide.
*This new SEC rule applies to open-ended funds and ETFs. Closed-end funds and certain other fund types are exempt.
Our representatives and specialists are ready with the solutions you need to advance your business.
Want to speak with a sales representative?
| Table Heading | |
|---|---|
| +1 800 353 0103 | North America |
| +442075513000 | EMEA |
| +65 6438 1144 | APAC |
Your sales rep submission has been received. One of our sales representatives will contact you soon.
Want to speak with a sales representative?
| Table Heading | |
|---|---|
| +1 800 353 0103 | North America |
| +442075513000 | EMEA |
| +65 6438 1144 | APAC |